HOSOKAWAMICRON CORPORATION
- Industries & Machines Industries & Machines
- IIoT IIoT
- Service-Toll Processing Service-Toll Processing
- Material Material
- News News
- IR Information IR Information
- Sustainability Sustainability
- Jobs and Careers Jobs and Careers
-
About Us
About Us
About Us
- Greetings (Company Introduction)
- Hosokawa Micron Group "Basic Human Rights Policy"
- Hosokawa Micron Group "Basic Policy on the Environment"
- Management Philosophy
- Corporate Overview
- Executive Officers
- Corporate Profile
- Business Areas and Strengths
- Corporate History
- Hosokawa Micron Group
- Domestic Facilities
- Overseas Subsidiaries (Asia)
- Overseas Subsidiaries (Europe)
- Overseas Subsidiaries (America)
- Asian Agents
- Powder Technology Research Institute
- Annual Publication "Micromeritics"
- Industrial Property Rights
- Journals and Books
- Technical Information
- Compliance Charter
- Privacy Policy
- Cookie Policy
- Quality Principle
Sustainability
- TOP
- Sustainability
- Environment
- GHG emission & Energy consumption
GHG emission & Energy consumption
Green House Gas (GHG) Emission Calculation
Since FY2022, we have been working on the calculation of GHG emissions at our group companies in Japan. Based on the data obtained from these calculations, we will first consider specific action plans to achieve our reduction targets for Scope 1 and Scope 2 emissions from our own operations by 2030. As a manufacturer of industrial machinery, our company is characterized by the fact that emissions from the "Use of sold products" under Scope 3 Category 11 account for well over 90% of our total emissions. Therefore, it is essential for us to improve the productivity and energy efficiency of our products as well as to reduce Scope 1 and Scope 2 emissions. Our Sustainability Committee, composed of knowledgeable members from various departments within the company, discuss these issues on a daily basis to work to set Key Performance Indicators (KPI) for reducing GHG emissions.
GHG emissions (FY2025) *Calculated for: Hosokawa Micron Corporation Entire Global Group
.png)
.png)
.png)
Detail : Unit(k-ton CO2e : metrict ton)
Major Group Company: Japan Domestic + Major sites (Germany, Netherlands, U.K. and U.S.A.)
| Scope | Category | FY2022 Japan Domestic |
FY2023 Japan Domestic |
FY2024 Japan Domestic |
FY2024 Major Group Company |
FY2025 Japan Domestic |
FY2025 Entire Global Group |
|---|---|---|---|---|---|---|---|
| 1 | ― | 0.394 | 0.387 | 0.381 | 2.536 | 0.418 | 3.478 |
| 2 | ― | 1.865 | 1.425 | 1.513 | 2.298 | 1.520 | 6.044 |
| 3 | 1 | 50.744 | 56.603 | 55.967 | 240.570 | 46.262 | 101.922 |
| 2 | 0.325 | 0.371 | 0.465 | 12.488 | 2.394 | 5.792 | |
| 3 | 0.297 | 0.295 | 0.287 | 1.218 | 0.297 | 2.412 | |
| 4 | 0.607 | 0.641 | 0.627 | 15.628 | 0.503 | 3.491 | |
| 5 | 0.553 | 0.590 | 0.659 | 2.243 | 0.675 | 2.842 | |
| 6 | 0.061 | 0.064 | 0.064 | 1.198 | 0.066 | 1.133 | |
| 7 | 0.690 | 0.685 | 0.718 | 1.798 | 0.749 | 2.200 | |
| 8 | 0.373 | 0.345 | 0.347 | 0.398 | 0.326 | 0.327 | |
| 9 | 0.002 | 0.004 | 0.011 | 0.311 | 0.003 | 4.563 | |
| 10 | 0.000 | 0.000 | 0.000 | 0.000 | 0.000 | 0.000 | |
| 11 | 2,920.986 | 1,775.722 | 1,699.588 | 3,788.450 | 1,690.092 | 5,500.822 | |
| 12 | 0.027 | 0.025 | 0.023 | 0.562 | 0.022 | 0.503 | |
| 13 | 0.000 | 0.000 | 0.000 | 0.000 | 0.000 | 0.000 | |
| 14 | 0.000 | 0.000 | 0.000 | 0.000 | 0.000 | 0.000 | |
| 15 | 0.000 | 0.000 | 0.000 | 0.000 | 0.000 | 0.000 | |
| 小計 | 2,974.665 | 1,835.345 | 1,758.756 | 4,064.870 | 1,741.389 | 5,626.009 | |
| 合計 | ― | 2,976.924 | 1,837.157 | 1,760.650 | 4069.704 | 1,743.327 | 5,635.531 |
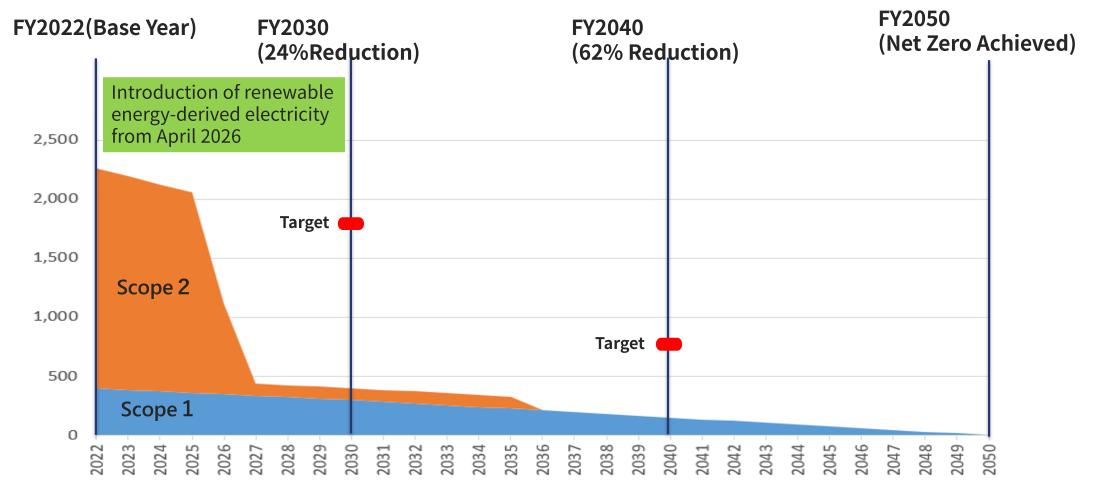
GHG Emissions Reduction Roadmap
Climate action is key to building a sustainable society and enhancing our corporate value. We have set medium- to long-term GHG reduction targets for Scope 1 (direct emissions) and Scope 2 (indirect emissions from purchased energy), supported by a clear roadmap to achieve them. The figure below shows our reduction targets by milestone year. We will progressively develop and implement concrete measures based on this roadmap. For Scope 3 (supply chain emissions), we will strengthen engagement with our business partners while continuing internal reduction efforts where feasible.
Breakdown of Scope 1 Emissions
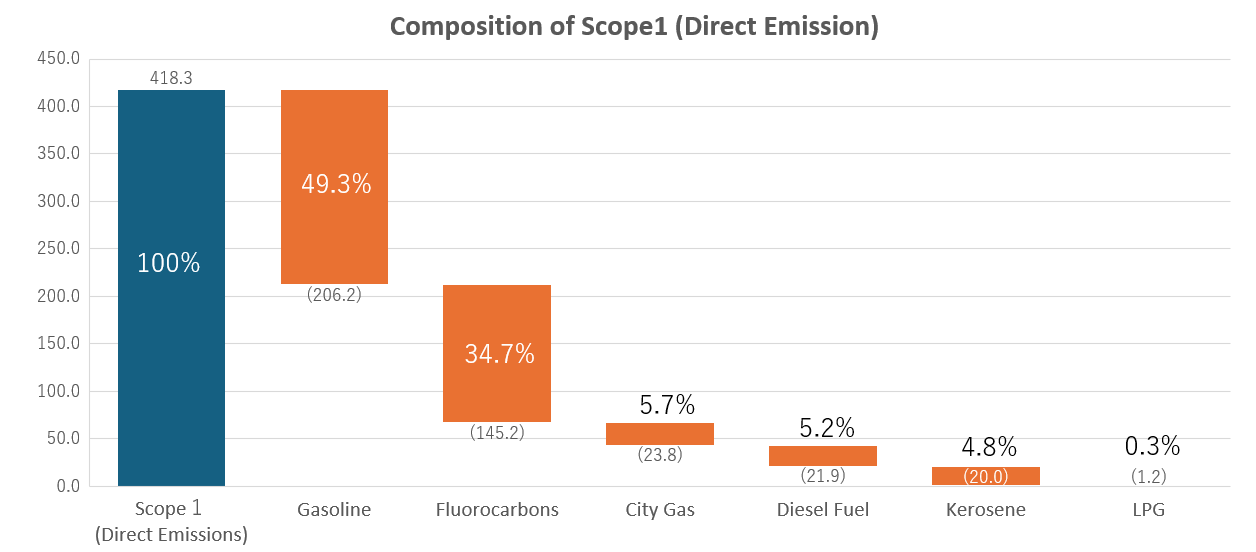
The chart below shows the breakdown of our Scope 1 (direct) emissions. Gasoline, primarily used for company vehicles, accounts for nearly half of the total, while fluorocarbons and alternative fluorocarbons—used in air-conditioning equipment and the like—make up the next largest share. The remainder consists of city gas, diesel, kerosene, and LPG. We will focus first on the largest emission sources as we explore reduction opportunities going forward.
Energy consumption
The Hosokawa Micron Group discloses energy consumption from petrochemical and non-petrochemical resources in accordance with CSRD (Corporate Sustainability Reporting Directive).
| Unit : MWh |
FY2022 Japan Domestic |
FY2023 Japan Domestic |
FY2024 Japan Domestic |
FY2024 Major Group Company |
FY2025 Japan Domestic |
FY2025 Entire Global Group |
|---|---|---|---|---|---|---|
| Total energy consumption from non-renewable sources | 4,573.200 | 4,534.100 | 4,412.700 | 17,472.649 | 4,576.400 | 28,108.738 |
|
933.600 | 899.400 | 891.700 | 2,516.522 | 999.700 | 4,069.757 |
|
123.300 | 137.800 | 126.700 | 8,044.167 | 118.300 | 9,171.929 |
|
3,516.300 | 3,496.900 | 3,394.300 | 6,911.960 | 3,458.400 | 14,867.052 |
| Total energy consumption from renewable sources | 396.200 | 397.300 | 364.106 | 5,058.279 | 357.100 | 5,989.984 |
|
0.000 | 0.000 | 0.000 | 4,694.173 | 0.000 | 5,355.714 |
|
396.200 | 397.300 | 364.106 | 364.106 | 357.100 | 634.270 |